Key Takeaways
- The OOB Social Attention Cost 2026: UK brands paid ≈25p for every hour Britons spent on social media in 2025, about 0.4p per minute
- That is ≈£207 of ad spend per UK social media identity per year (£3.98/week)
- The price is inflating: about 25p in 2025 vs an implied 21p in 2024, as spend grew 21% into a near-flat pool
- Method: IAB UK £11.5bn social ad spend ÷ 46.8bn UK attention-hours (DataReportal). CC-BY, free to cite
Every year we run one calculation. Take everything UK advertisers spent on social media, then divide it by every hour Britain spent scrolling. For 2025, that’s about 25p an hour.
That’s the OOB Social Attention Cost. A market average, not a rate card. No single advertiser pays 25p, and no user ever sees a penny of it. It’s the price of the nation’s attention, boiled down to one number you can actually feel.
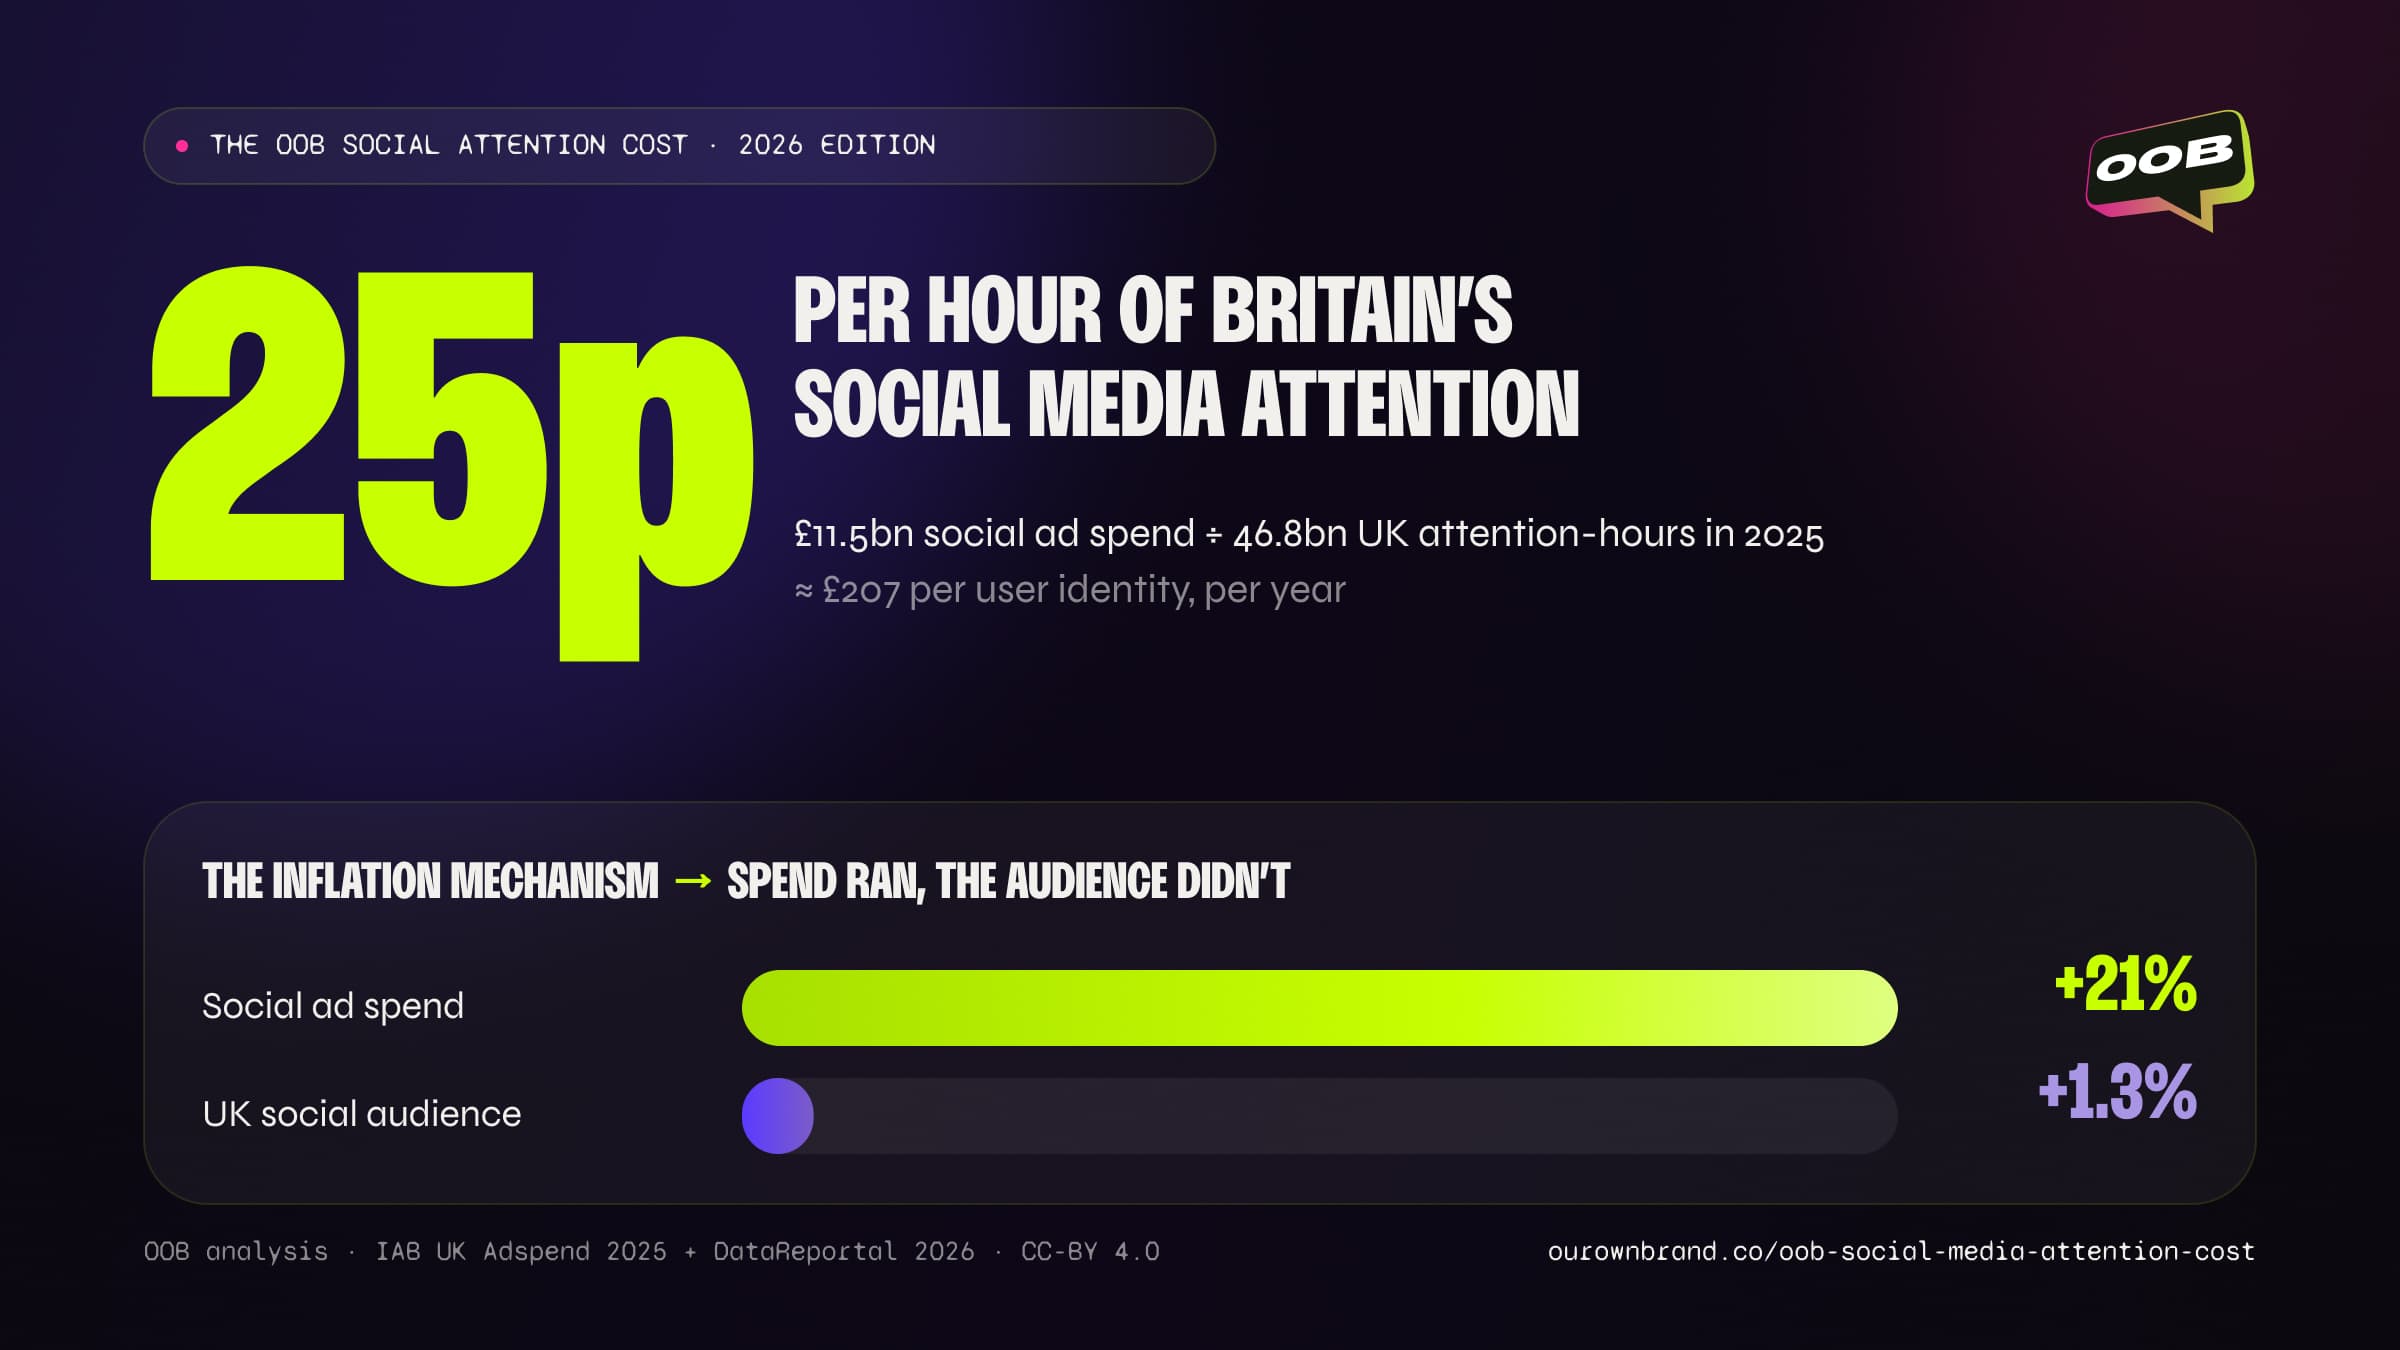
It’s up from an implied 21p the year before. The reason is blunt: social ad spend grew 21% in a year while the audience, and the hours it gives, barely moved. We built it from the two sources that carry the most weight here, IAB UK’s Digital Adspend 2025 and DataReportal’s Digital 2026. Neither publishes the figure on its own.
Last updated 3 September 2026 · Current editions: DataReportal Digital 2026 (UK) · IAB UK Digital Adspend 2025 · Ofcom Online Nation 2025.
Why the price is increasing
The UK is basically full. At 79.7% penetration there aren’t many new people left to reach, and DataReportal shows the platforms now grow by taking time off each other, not by signing up newcomers. Total time online crept up about ten minutes a day last year (Ofcom, Online Nation 2025). Social barely shifted.
So when advertisers spend a fifth more to reach the same pile of hours, something gives. Maybe it’s higher auction prices. Maybe it’s more ads jammed into every hour. For whoever’s paying the bill it doesn’t matter which: it’s the same money buying less attention.
Our view? This only goes one way. Attention is the one thing in this market you can’t manufacture. You can print more budget; you can’t print more hours in the day. Everyone piling in is bidding for a slice of the same fixed thing, and the bids keep climbing.
Spend grew 21%. The audience barely moved.
Full-year 2025 growth in UK social ad spend vs UK social audience growth (Jan–Oct 2025, annualised). On 2025 inputs spend growth is running about 12 times audience growth; the robust statement is the gap itself.
Source: IAB UK Digital Adspend 2025 (spend, full year); DataReportal Digital 2025 → Digital 2026 UK editions (identities +1.3% Jan→Oct 2025, ≈1.7% annualised)
“Attention’s only cheap if someone actually gives it to you,” says Sarah Fulford-Williams, co-founder of Our Own Brand. “You can’t buy your way out of this one. The brands that win are just making things people want to watch, and then the platform does the distribution for free. Everyone else is paying more to shout louder.”
So what do you actually do about it? You don’t outspend it. You can’t. Everyone’s bidding into the same pot of hours, so a bigger budget just pays the going rate. The only real move is to be worth watching: make something good enough that the algorithm carries it for nothing. Boring brands rent their reach, and the rent goes up every year. The good ones don’t pay it.
The numbers
Our Own Brand analysis, August 2026 · CC-BY 4.0, free to cite with attribution
The OOB Social Attention Cost: 2026 edition (full-year 2025 data)
| Metric | Figure |
|---|---|
| Cost of one hour of UK social media attention | ≈ 25p (24.5p) |
| Implied cost per hour, 2024 (derived) | ≈ 21p (20.6p) |
| Cost per minute of UK social attention | ≈ 0.4p |
| Ad spend per UK social media identity, per year |
How we calculated it
The method is deliberately simple and fully reproducible from public primary sources:
- Spend: UK social media advertising spend was £11.5 billion in 2025, up 21% year on year and 28% of the £40.5bn UK digital ad market (IAB UK / Oliver Wyman, Digital Adspend 2025).
- Attention: the UK had 55.5 million social media user identities (79.7% of the population), each averaging a self-reported 16 hours 13 minutes per week on social platforms (GWI survey data covering internet users aged 16 to 64; DataReportal, Digital 2026: The United Kingdom, data October 2025). That multiplies to ≈ 46.8 billion hours of UK social attention a year.
- Division: £11.5bn divided by 46.8bn hours is about 24.5p an hour. Per identity, £11.5bn across 55.5m works out at roughly £207 a year, or £3.98 a week (identities can outnumber real people, so the true per-person figure is higher).
Honest limitations: “User identities” from ad tools can outnumber real people, one person with three accounts. That cuts both ways. Fewer real people pushes the per-person figure up; fewer real hours shrink the pool, which nudges the per-hour price up too. The identity count is all-ages, while the time average is survey data for 16- to 64-year-olds, so the multiplication assumes working-age usage intensity holds across all ages. That is a known approximation. “Attention” here is shorthand for time spent on social platforms. It is not eyes-on attention as measured by attention vendors, and since not all time on an app is active attention, the true price per attentive hour is higher. Spend (IAB’s social line) and time (DataReportal’s social measure) also use different platform definitions; YouTube is the clearest case, with much of its ad spend counted by IAB as video rather than social. That’s why we treat 25p as an order-of-magnitude floor rather than a precise unit price: given the uncertainty in the survey-based inputs, the honest range is the low-to-mid 20s of pence. The spend figure is based on IAB UK’s methodology and differs from DataReportal’s own ad-spend cut ($12.8bn, about £9.8bn); we use IAB throughout as the UK industry standard and don’t blend the two. And the two lineages agree: DataReportal’s spend estimate against the same hour pool implies about 21p. A different source, the same ballpark. None of this changes the order of magnitude or the trend direction.
Where this sits: the method has a lineage we’re glad to stand on. Kevin Kelly priced an hour of blended US media attention at about $2.50 back in 2011, dividing industry revenue by national attention-hours. As far as we can tell, ours is the first to put a market-level price on the UK’s social attention. We price it off current spend and current usage, and we’ve committed to running it every year.
Tracking the Attention Cost over time
This 2026 edition is the baseline year of the OOB Social Attention Cost. We looked hard at publishing a 2023–2025 back-series and chose not to, because we can’t build it honestly. IAB UK published no standalone social ad-spend figure before its 2025 report, and DataReportal changed how it measures time on social between editions. Any multi-year UK attention-cost series you see elsewhere therefore rests on estimated inputs.
One prior-year figure can be derived honestly, and we label it as such. IAB’s 2025 report publishes both the spend level (£11.5bn) and its growth (+21%), which implies a 2024 base of about £9.5bn. For the 2024 pool we take DataReportal’s Digital 2025 identity count (54.8m) and hold weekly hours at the 2025 figure, because the two editions don’t measure time on a comparable basis. That gives about 46.2bn hours and an implied 2024 cost of about 21p an hour (20.6p), against 24.5p in 2025. Worth stating plainly: because we hold time-per-user constant, the year-on-year rise is driven by spend (up 21%) against a near-flat identity count, not by any measured change in hours. We publish 21p as an implied figure, not a measured one, because IAB never published a standalone 2024 social line. From here each annual edition measures change using a consistent, stated method, and future editions will extend to platform-level, sector, and US cuts.
The wider dataset
This analysis is one output of our maintained UK social media statistics hub: headline figures, the full platform league table and demographics, all from primary sources. The companion analysis, the Attention Value Gap, values this same attention pool at wage rates. Per-platform deep dives: Instagram, TikTok, YouTube, Facebook and influencer marketing.
Using and citing this analysis
This is derived analysis, not a new survey. We combined two public primary sources, IAB UK’s ad spend and DataReportal’s usage data, into a figure neither publishes on its own. It’s free to reuse under CC-BY 4.0, with attribution to “Our Own Brand analysis of IAB UK and DataReportal data, 2026” and a live link to this page. Download the headline chart (SVG or JPG) and the full dataset (CSV). The licence covers our derived analysis only; the underlying IAB UK and DataReportal data remain subject to their own terms. This is the baseline edition of an annual benchmark, updated as each IAB and DataReportal report lands.
Two things worth getting right if you quote it: (1) 25p is what advertisers pay to reach the UK’s social attention, not money users receive, and users get nothing; (2) 25p (the cost to advertisers of an hour of social time) and £12.21 (that hour’s notional worth at the wage floor) are a deliberate contrast, not two versions of one figure. The full method and its limitations are set out above and in the one-page methodology note. Want the numbers cut by platform, sector or demographic, or a walkthrough of how the metric is built? Get in touch.
Want a team to make this happen for your brand? OOB is a full-service social media agency in London, with strategy, content, paid and community under one roof.
This one's on us.
OOB is a social media agency. If this sparked something, let's talk.